Recent surges have shown strength in technical indicators, with some analysts suggesting potential for further price increases.
XRP is currently forming a head-and-shoulders pattern on the weekly chart, with the $2 support level emerging as the critical threshold that will likely determine its next significant move.
The Head and Shoulders Pattern Emerges
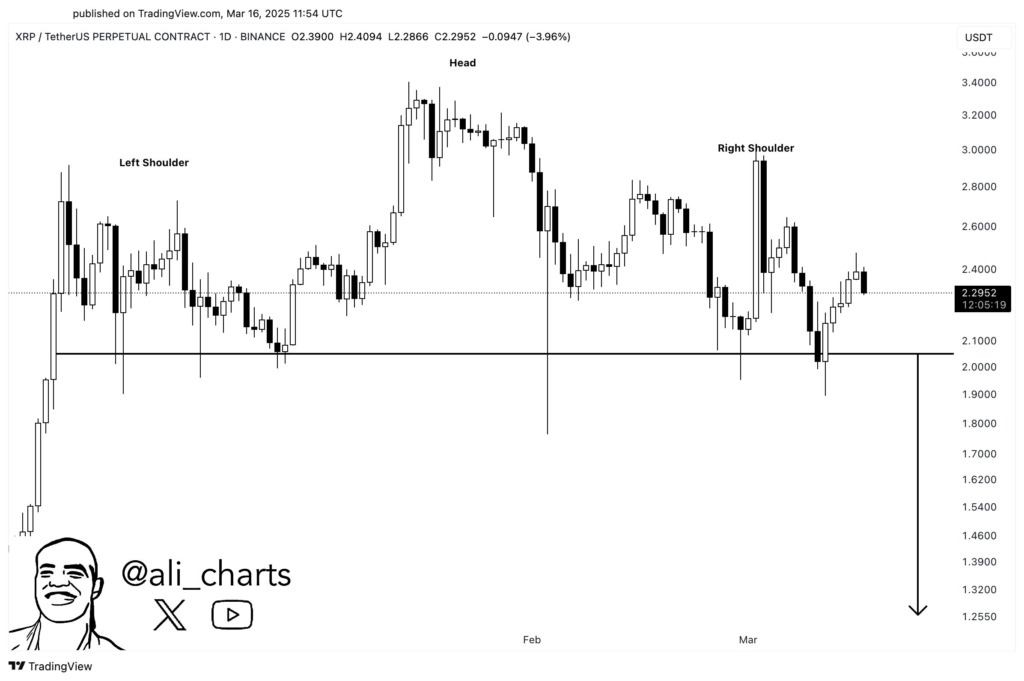
According to technical analysis by Ali_chart, the XRP/USDT trading pair is displaying a classic head and shoulders pattern, widely recognized as a bearish reversal signal in technical analysis.
This formation has become increasingly apparent on the weekly timeframe, with the left shoulder, head, and right shoulder clearly defined. The neckline sits at approximately $2.00, establishing this price point as a crucial support level that traders are closely monitoring.
Why the $2 Support Level Matters
The $2.00 price point isn’t just a psychological barrier—it represents the neckline of the head and shoulders pattern, as highlighted in Ali_Chart’s analysis. This level is particularly significant because if XRP manages to maintain support here, it could potentially bounce back or enter a period of consolidation. However, if the price breaks below this threshold, it could trigger a substantial bearish movement.
Should XRP fail to hold the $2.00 support, Ali_Chart’s technical analysis suggests a possible drop proportional to the height from the head to the neckline.
This projects a potential target around $1.25 to $1.30, representing a significant decline from current levels. Such a move would likely attract increased selling pressure and could reshape market sentiment.
Trading volume will play a crucial role in confirming any breakdown or bounce. A drop below $2.00 accompanied by high volume would strongly validate the bearish outlook. Conversely, if XRP breaks below this level with low volume, it might indicate a false breakdown or a temporary dip rather than a sustained downtrend.
Read Also: Chainlink (LINK) Gearing for Massive Rally: Here Are Key Levels and Prices to Watch
The Path Forward
For bullish traders, XRP needs to not only hold the $2.00 support but also reclaim levels above $2.40 to invalidate the bearish setup, according to Ali_Chart. This would suggest that the head and shoulders pattern was a false signal, potentially opening the door to renewed upside momentum.
For bearish traders, confirmation of a break below $2.00 could present an opportunity, with the aforementioned target of approximately $1.25 in view. However, prudent traders will wait for volume confirmation and additional technical signals before making significant moves.
Follow us on X (Twitter) and Coinmarketcap for more real-time market updates.
The information provided on Web3parrot.com is for general informational purposes only and are opinions of the expert writers. They are not intended as financial, investment, or trading advice. Please do your own research and consult with a licensed financial advisor before making any financial decisions.