Ethereum is a decentralized blockchain platform that enables smart contracts and decentralized applications (dApps). The current price is around $3,200, with a 10% decrease in the last 24 hours.
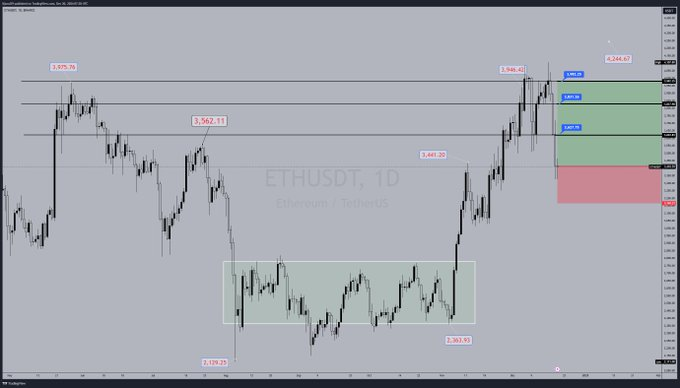
Crypto analyst Rai Imran on X noted that Ethereum has recently shown bullish momentum, successfully breaking through the critical resistance level of $3,441.20.
This positive movement signals potential gains, with the analyst eyeing several key targets and support zones that could influence trading strategies in the upcoming days.
Ethereum Current Price Action
As Ethereum continues to exhibit strength, traders are advised to focus on the following targets:
- Immediate Target: $3,562.11
- Next Resistance Levels: $3,946.42 and $4,244.67
These are levels where traders may look to take profits or expect the price to reach based on current momentum.
Support Levels
In addition to key resistance levels, it’s essential to identify support zones that could serve as buying opportunities:
- Primary Support: $3,381.26
- Secondary Support: $3,627.75
Technical Analysis Breakdown
Rai gave a technical analysis of Ethereum price on a daily timeframe revealing some insights: The chart features a rectangular shaded area, signifying a consolidation phase where Ethereum has traded sideways for an extended period.
This range-bound movement often precedes significant price action, making it a focal point for traders.
Support and Resistance Zones
- Resistance Levels: Key resistance zones are situated near $3,562.11 and higher. A break above these levels could validate a bullish continuation.
- Support Zones: Important support levels around $2,839.93 suggest where buying interest could emerge if the price retraces.
READ ALSO: Analyst Predicts Ethereum (ETH) Price to Hit $18,000 This Cycle, Explains Why
Potential Trade Zones
- Buy Zones: Green areas on the chart highlight potential buying opportunities, indicating demand zones where traders might look to accumulate positions.
- Stop-Loss Zones: Red areas identify potential stop-loss or invalidation zones, which are critical for risk management if the price falls below these levels.
The chart also displays blue price targets, which act as likely take-profit levels for traders. These targets reinforce the bullish sentiment surrounding Ethereum, suggesting that if the momentum continues, further upside could be realized.
If Ethereum’s price can maintain its position above these support levels, the analyst anticipates further price increases, potentially reaching $4,244.67.