With the recent breakout in price, an analyst known as Wallstreet Queen is expecting a price pump to follow. With the market looking promising, she takes the opportunity to open a small long position. This move reflects confidence in HBAR’s price potential upward trajectory.
HBAR Price Symmetrical Triangle Pattern
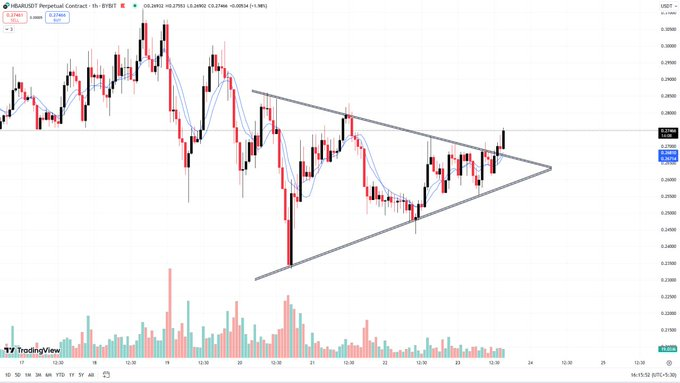
The chart analysis for Hedera on a one-hour time frame reveals a classic symmetrical triangle pattern, where the price has been consolidating between converging trendlines.
This pattern is indicative of a period where market participants are in a state of indecision, but historically, symmetrical triangles tend to act as continuation patterns. Given HBAR’s prior trend, a breakout to the upside is the more likely scenario.
Volume Analysis
Looking at the volume dynamics, there’s a noticeable decrease as HBAR’s price action tightens within the triangle. This reduction in volume is typical before a significant breakout as traders await a clear direction. A breakout with an accompanying surge in volume would be a strong confirmation of the move, suggesting that the market has found its direction and is ready to push HBAR’s price.
Breakout Attempt
Recent price action shows HBAR attempting to break out of the symmetrical triangle to the upside. This is a critical moment for the cryptocurrency, as a confirmed breakout above the resistance trendline could signal the beginning of a bullish trend. For this breakout to be considered valid, it’s essential that the price not only breaks but also sustains above this level, with a preference for increased trading volume to back the move.
The analysis of moving averages on the HBAR chart shows the shorter-term moving averages, likely the 9 EMA and 21 EMA, converging as the price approaches the apex of the triangle. This convergence often precedes a breakout, providing additional support for the bullish case. Should these EMAs cross upwards post-breakout, it would further validate the bullish momentum, potentially attracting more buyers into the market.
Potential Bullish Scenarios
If HBAR closes above the triangle’s resistance with a significant increase in volume, the next resistance levels could be in sight. Analysts are watching for HBAR to potentially test higher price points, aiming for levels that could signify a substantial pump in its value.
The current chart pattern and indicators for Hedera suggest that we might be on the cusp of a significant price movement. The analyst is particularly focused on the breakout dynamics, with a keen eye on volume and moving average crossovers to confirm the direction.