MyNeighborAlice (ALICE) token has been trading sideways between $0.31 and $0.57 since mid-March. As of May 18-19, the token has been hovering around the $0.45-$0.52 level, showing little decisive movement in either direction. This sideways trading range indicates a period of equilibrium between buyers and sellers, which typically resolves with a stronger directional move.
Technical indicators for ALICE are currently giving mixed signals, though many are beginning to tilt bearish. While some oscillators and momentum measures still suggest a potential bullish breakout from this consolidation, warning signs of an impending correction are becoming more prominent.
According to data from Investing.com Analytics, the Relative Strength Index indicator, for example, is showing a neutral reading on the daily chart, which means that the price can still move either way.
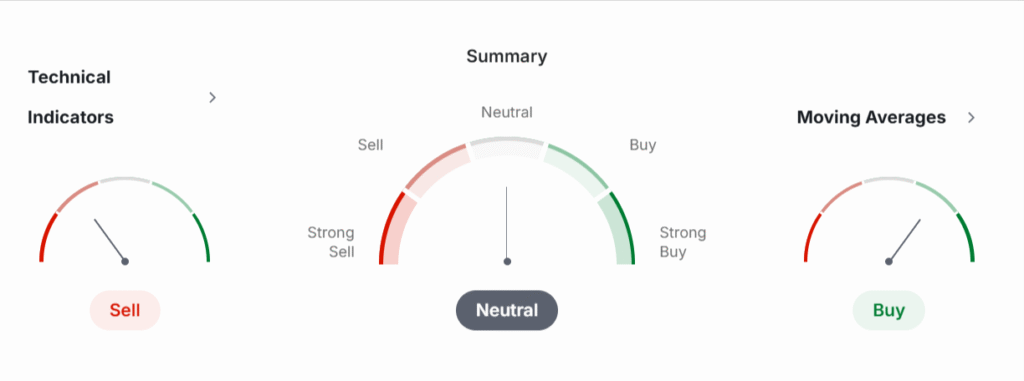
The Stochastic indicator, on the other hand, is showing a sell signal, while the Moving Average Convergence Divergence indicator is showing a buy signal. This divergence in indicators reflects the current market uncertainty about ALICE’s next significant move.
Crypto analyst Crypto Patel has identified what he believes is a clear short opportunity. In a tweet, Crypto Patel explained that ALICE has tapped into a bearish Advance Order Block after sweeping Buy Side Liquidity levels.
This market behavior, according to Patel, signals smart money distribution, where larger institutional traders are selling their positions. The price action is now showing bearish displacement, which indicates momentum shifting downward and points toward lower liquidity levels being targeted.
The analyst has outlined a specific short strategy with an entry at $0.4621, targeting a price level of $0.3720, and a stop loss placed at $0.5214. Patel emphasized that current momentum indicators favor bearish sentiment and advised traders to let this technical setup play out without premature intervention.
Smart Money Movement and Order Blocks
Diving deeper into the technical structure, Crypto Patel’s chart analysis identifies two key “Advance Order Block” zones. Order blocks are price areas where significant buying or selling occurred before a strong move in the opposite direction. These zones often represent institutional interest levels and can act as strong support or resistance.
The upper zone Patel identified sits around $0.54-$0.59 with Buy Side Liquidity positioned above it. Buy Side Liquidity refers to clusters of buy orders or stop losses that larger traders may target before reversing price direction. The lower Order Block, approximately between $0.48-$0.50, has just been tested by the price, which is now showing signs of rejection.
Is $ALICE Setting Up for a Major Drop? Here’s the Short Setup!#ALICE just tapped into a bearish Advance OB after sweeping BSL — clear sign of smart money distribution.
— Crypto Patel (@CryptoPatel) May 19, 2025
We’re now seeing bearish displacement, aiming for lower liquidity levels.
Short Setup
▶️ Entry: $0.4621
▶️… pic.twitter.com/OejzhqkCJL
These Order Blocks typically represent areas where institutional orders are placed and often function as reversal or rejection points in the market. When price returns to these zones, it frequently reacts in a predictable manner that can be traded, which is exactly what Patel is highlighting in his analysis.
Is ALICE Headed for a Liquidity Sweep?
A significant element in Crypto Patel’s analysis is the presence of Equal Lows around the $0.3720 level from April that have not yet been “swept.” In trading terminology, sweeping refers to price temporarily breaking through a level to trigger stop orders before moving in the opposite direction. These lows form what traders call a “liquidity pool” – an area where stop losses and limit orders accumulate, creating trading opportunities.
Read Also: Analyst Says Trump-Backed SEI Token Is Going Higher This Cycle: Reveals Target
Smart money concepts suggest that major market participants (institutions, whales) often drive prices to these liquidity areas intentionally. In this case, Patel believes ALICE’s price will be pushed down toward the $0.3720 level to collect this untapped liquidity.
The chart pattern suggests price action is likely to drop toward this liquidity zone, following what Patel identifies as a “Trendline Liquidity Run” (TLLR) pattern. This occurs when price builds up liquidity along a trendline before breaking out, and after capturing upside liquidity, typically retraces back down.
This market behavior is a hallmark of institutional trading strategies designed to maximize profitability while trapping retail traders on the wrong side of the market.
Follow us on X (Twitter) and Coinmarketcap for more real-time market updates.
The information provided on Web3parrot.com is for general informational purposes only and are opinions of the expert writers. They are not intended as financial, investment, or trading advice. Please do your own research and consult with a licensed financial advisor before making any financial decisions.