Bitcoin price is once again dipping, just hours after reaching a fresh local high around $107,000. Many traders had been expecting the BTC price to push into a new all-time high range this week, but the latest chart moves show a sharp pullback that has left investors questioning whether the rally is already losing steam.
Looking at the BTC price chart, one key level to watch now is $102,500. If the price breaks below this zone and it flips into a resistance after a failed retest, then a drop toward $9700, becomes more likely.
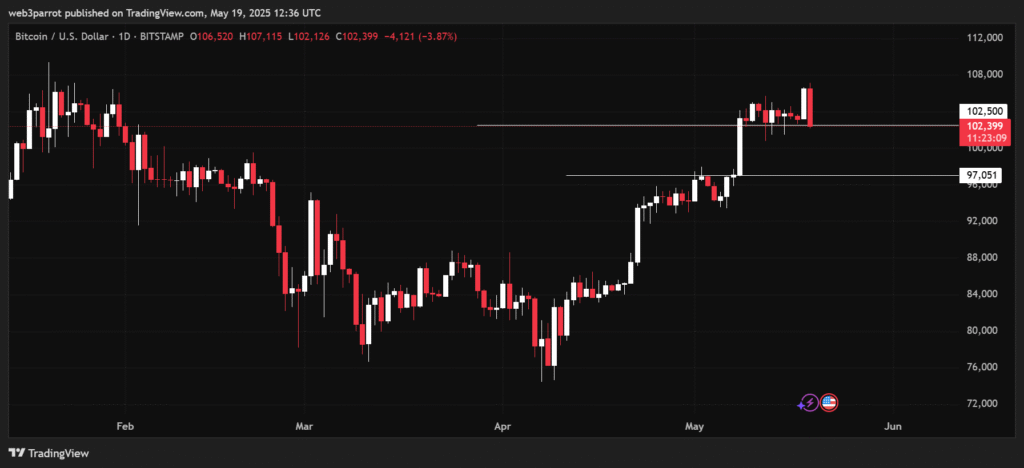
That $98,000 level has been acting as a strong support recently, so a bounce from there could still maintain the broader uptrend.
BTC Price Hits Resistance, Traders Take Profit
The current dip in Bitcoin price appears to be a reaction to a strong resistance zone. According to @thescalpingpro (Mags), a well-followed trader on X with thousands of followers, BTC recently tested the upper range resistance for the third time and got rejected. He pointed out that this level has been a difficult zone to break, and previous rejections from this same spot had triggered breakdowns.
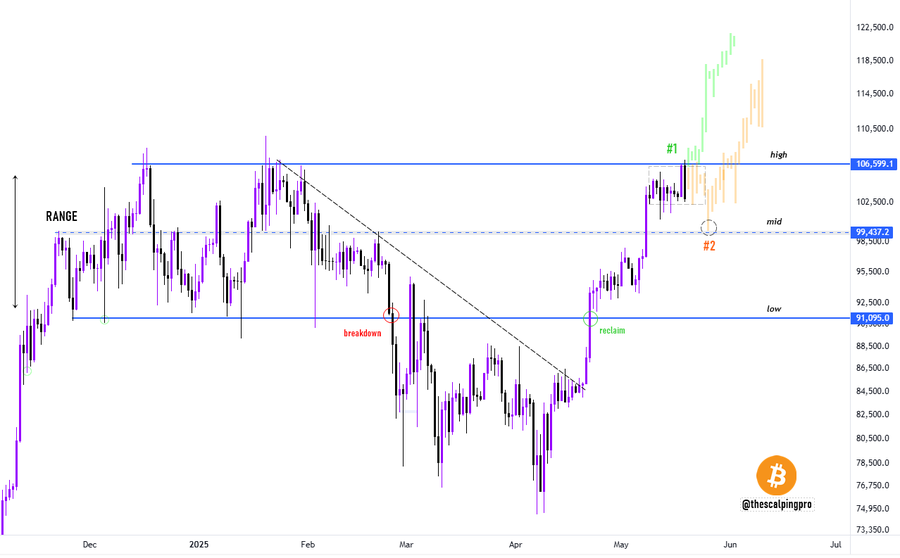
He then explained that Scenario 1 would see Bitcoin consolidate briefly and then break out aggressively above the current resistance.
Scenario 2, on the other hand, would involve a deeper pullback to the mid-range around $99,400 before eventually pushing higher. Both outcomes, according to him, are still bullish, but they follow different timelines.
Onchain and Bitcoin ETF Flow Data Support a Cooling Off
Another signal that Bitcoin may just be cooling off instead of fully reversing is the shift in ETF inflows. Ali, an onchain analyst who posts under @ali_charts, recently shared an update about how the massive Bitcoin ETF inflows seen in April have slowed down significantly.
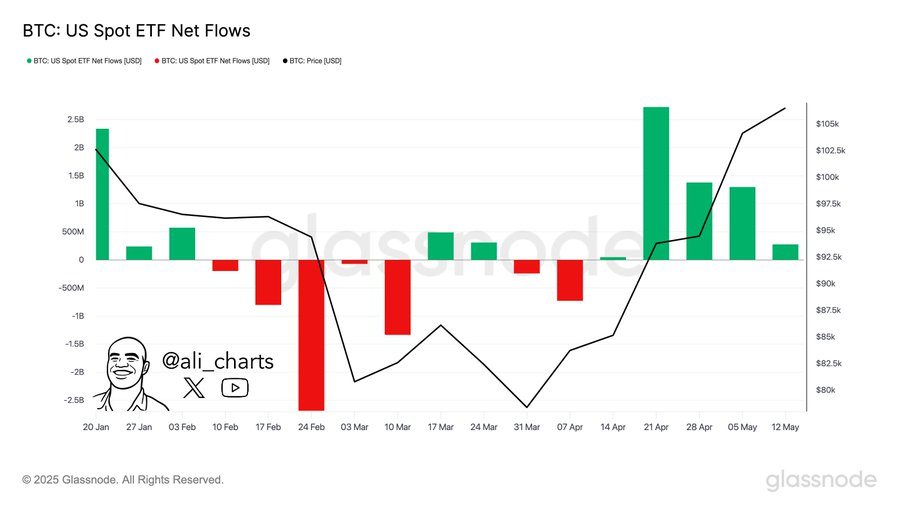
That decline in inflows suggests that institutional buying has slowed, at least for now. This reduction could mean that the explosive momentum from ETFs is taking a breather, allowing the market to shake out weak hands and reset.
Read Also: MetaMask to Support Solana Natively in May — What It Means for SOL
Still Looks Like a Short-Term Retracement
Putting it all together, this Bitcoin price dip still looks more like a short-term retracement than a full breakdown. Profit-taking, ETF slowdown, and resistance at the top of the range all seem to be contributing. But at the same time, the presence of strong supports at $102,500 and $97,000, and the fact that key analysts still see bullish scenarios in play, suggest the broader uptrend could resume soon.
So while the BTC price may be down today, it doesn’t mean the bullish move is over. It may just be a pause before the next leg higher. If the bulls reclaim control and push through resistance, a run toward a new all-time high could still be on the table.
Follow us on X (Twitter) and Coinmarketcap for more real-time market updates.
The information provided on Web3parrot.com is for general informational purposes only and are opinions of the expert writers. They are not intended as financial, investment, or trading advice. Please do your own research and consult with a licensed financial advisor before making any financial decisions.