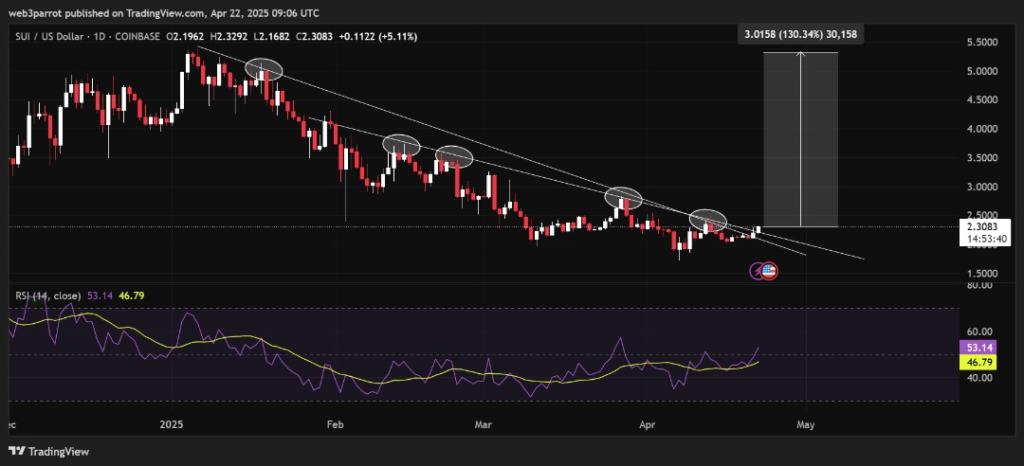
SUI price is breaking out. The chart shows SUI testing and now potentially breaking through a long-standing descending trendline that began in early 2025. This represents a significant technical signal that could mark a trend reversal for the asset.
The current breakout appears stronger than previous attempts, with a daily close above the trendline. This is particularly noteworthy given the multiple prior failed breakout attempts, each of which was met with selling pressure that drove the price back down.
The measured move points to a possible 130% rally, with the target around the $5.30 area. This price point aligns with a previous consolidation or resistance zone from earlier this year, making it a logical target for this bullish movement.
Read Also: SUI Price Could Surge to $10, Top Analyst Predicts: Here’s How
SUI Price Rally Depends on Bitcoin and Altcoin Strength
The RSI (Relative Strength Index) is currently around 53.14, positioning it above the neutral 50 zone while remaining well below the overbought level of 70. This suggests momentum is turning bullish, and there is plenty of room for upward movement before the asset becomes overbought.
For SUI price to rally as projected, BTC and the broader altcoin market need to show strength. If Bitcoin price continues moving sideways or experiences a dip, SUI token breakout may not sustain. A synchronized bullish move across major cryptocurrencies often validates such breakouts in altcoins like SUI token.
To achieve a rally to the top of the channel as expected in such a breakout, we want to see supportive bullish moves from Bitcoin and the wider altcoin market in the coming days.
Follow us on X (Twitter) and Coinmarketcap for more real-time market updates.
The information provided on Web3parrot.com is for general informational purposes only and are opinions of the expert writers. They are not intended as financial, investment, or trading advice. Please do your own research and consult with a licensed financial advisor before making any financial decisions.