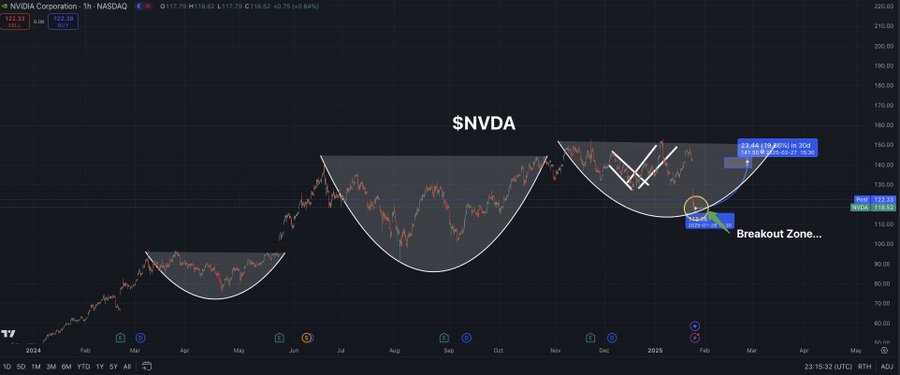
Currently, the price of NVDA is positioned in what the chart labels as the “Breakout Zone.” This zone indicates that the stock has surpassed the resistance level formed by the handle of the cup and handle pattern.
This breakout serves as a strong bullish indicator, suggesting that the previous resistance level is now acting as support, which could propel the stock price further.
NVIDIA Stock Analysis Shows Potential Breakout
In a recent post by Mike Investing on X, a detailed chart of NVIDIA Corporation stock was shared, presenting a promising outlook. The first pattern was observed from late 2022 into early 2023, leading to a notable price surge. Following this, a larger pattern has developed from mid-2023 to early 2024, indicating a period of consolidation before a potential breakout.
Mike pointed out that the sentiment surrounding NVDA price has recently hit a historical low, which he interprets as a sign that the stock has potentially bottomed out. This sentiment shift is crucial as historical data often shows that such lows in sentiment precede significant price rallies. This aligns perfectly with the technical breakout observed in the chart, enhancing the bullish case for NVIDIA.
NVIDIA Price Targets
According to the analysis, following this low sentiment, NVDA price could experience a rally of $50 or more in the short term. Mike Investing ambitiously forecasts a price target of $180+ by March. The chart’s breakout from the handle’s resistance supports this optimism, as such breakouts typically lead to substantial price increases in similar patterns.
READ ALSO: Ripple (XRP) Price Could Spike Over 100% in the Next 30 Days: Here’s Why
In summary, the analysis of the NVDA price chart combined with the sentiment analysis from Mike Investing suggests that NVIDIA price is at a critical juncture. The stock has broken out from a well-formed cup and handle pattern, historically a precursor to significant gains. The current low sentiment might indeed mark the bottom, setting the stage for a rally.