HBAR’s recent price action on HBAR has shown significant movements. The price has experienced a breakout from a symmetrical triangle pattern. The analyst behind the World of Charts page on X delves into the technical analysis of HBAR price, exploring the implications of this breakout and what it could mean for the future price trajectory.
Breakout Analysis and Price Target Estimation
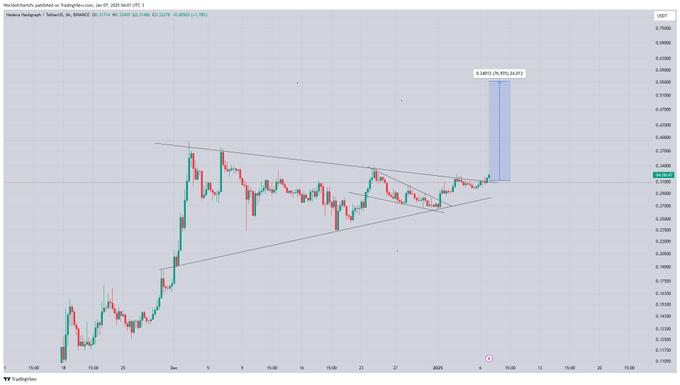
The recent analysis by the analyst shows a breakout of HBAR price from the symmetrical triangle has been markedly bullish. The price not only broke above the upper resistance trend line but did so with a substantial candlestick, closing well above the previous resistance level. This breakout is a strong signal for traders, indicating that the demand for HBAR has overcome the supply, pushing the price higher.
READ ALSO: Analyst Releases Prediction for Ripple in 2025: XRP Price Analysis
For symmetrical triangles, a common method involves measuring the height of the triangle at its widest point and adding this to the breakout point. If we consider the widest part of the triangle to be around $0.14 (from $0.28 to $0.14) and the breakout occurred near $0.34, a projected target could be around $0.48, assuming the breakout holds and momentum continues.
The breakout of HBAR price from the symmetrical triangle pattern signals a bullish phase, suggesting that HBAR might be gearing up for another significant upward wave.