Fantom FTM is the native utility token for staking, governance, and network fees within its ecosystem with a high-performance, scalable blockchain platform designed for decentralized applications (dApps) and DeFi solutions.
The price of Fantom in the market is currently trading around $1.38 and it is 12% up in the last 24 hours. AmCrypto analyst on X gave a technical analysis of the price action for Fantom (FTM) presenting the future price movements of FTM.
Chart Showing Fantom Future Price Movement
The analyst drew an upward-sloping trendline, connecting key swing highs in the price action of FTM. the price tested this trendline again, as shown with an arrow on the chart. Each interaction with the trendline has historically marked resistance points, where the price has exhibited noticeable hesitation or rejection.
The chart features a prominent resistance zone marked in yellow, spanning the $1.10 – $1.25 range. This level previously acted as a strong resistance but flipped into support, demonstrating a Perfect Retest. Such behavior is critical, indicating that traders are paying close attention to this price area, which could act as a safety net during pullbacks.
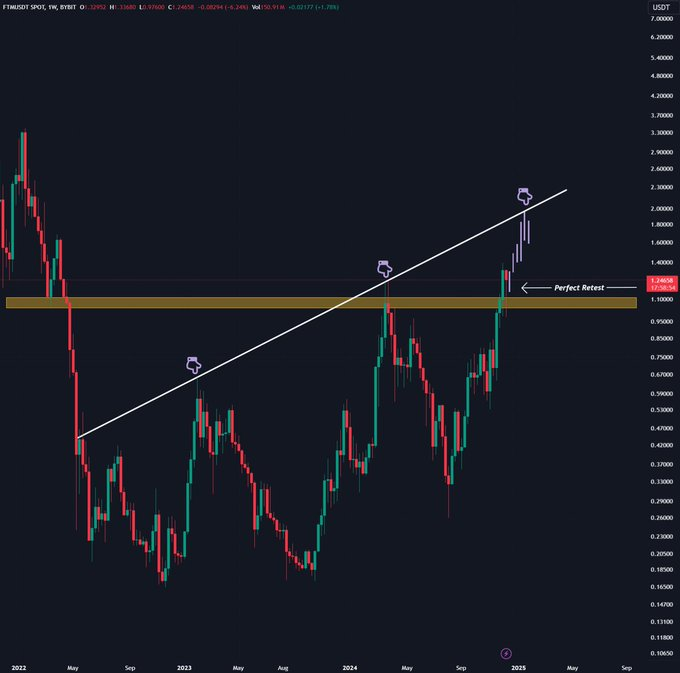
Breakout and Retest
FTM’s price broke above the horizontal resistance zone and executed a perfect retest of this level, a pattern typically viewed as a bullish signal. Following this retest, the price resumed its upward momentum, suggesting that buyers are regaining control and pushing for higher prices.
READ ALSO: Kaspa (KAS) Technology Set to Be a Game-Changer in 2025 Bull Run: Crypto YouTuber
Fantom Current Price Action
Currently, the FTM price is hovering near the trendline resistance. This positioning could signal a crucial decision point for the price:
- A potential rejection could lead to a short-term correction, drawing prices back towards the support zone.
- Conversely, a breakout above the trendline would indicate a strong bullish continuation, with the $2.00 level emerging as the next target.
READ ALSO: Why Holding Onto Ripple (XRP) Could Be Your Smartest Move in 2025: Crypto YouTuber
The chart analysis indicates strong bullish momentum after a breakout and retest of a key resistance level. This confirms strong buying interest and a potential continuation of the uptrend. Alternatively, a breakout above the trendline may target the psychological $2.00 level for further gains.